How one guy deleted 97% of his company's dashboards (and why that's actually genius)
Original: Getting Rid of Dashboard Sprawl
Summary
Struggling with dashboard overload? This blog post offers a solution to the problem of "dashboard sprawl" - the proliferation of dashboards that can overwhelm data teams. By introducing techniques for consolidating and streamlining your dashboard ecosystem, you can enhance data visibility, improve decision-making, and free up valuable time for deeper analytics work. Data professionals seeking to optimize their reporting infrastructure and enhance the impact of their analytics will find this insight particularly compelling.
Who This Is For
Analytics Engineers
Data Engineers
Business Analysts
Key Takeaways
- Learn why dashboard sprawl happens - managers need intuitive decision-making but get fragmented views instead
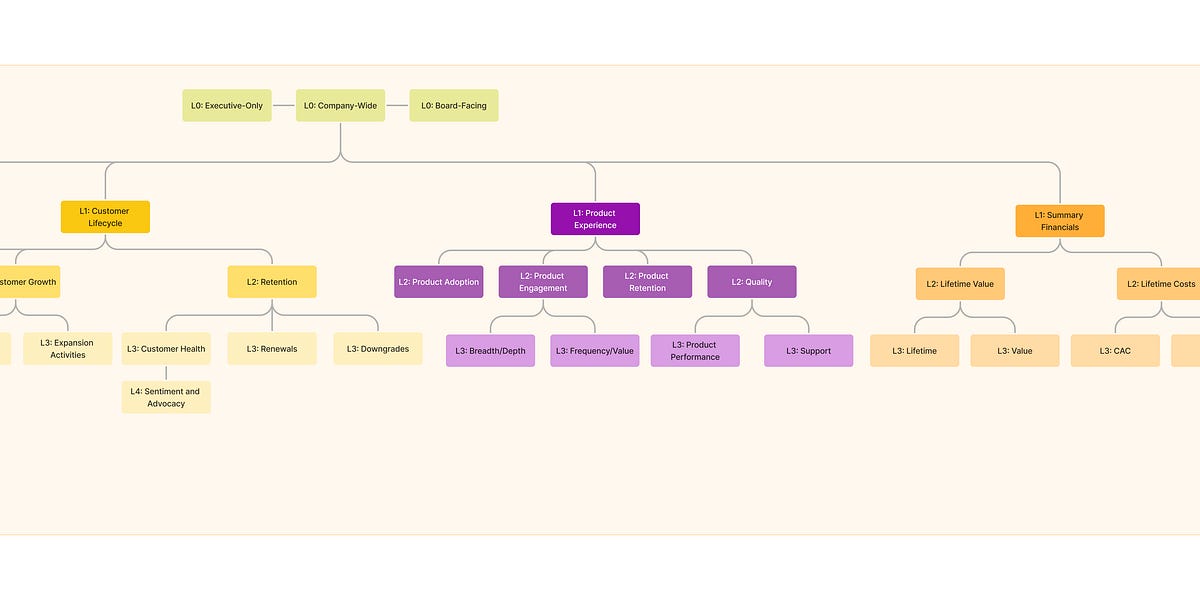
- Implement dashboard trees: hierarchical, bounded structures that cascade from high-level metrics to detailed breakdowns
- Focus on defining key organizational metrics as the foundational primitive before building any dashboards
- Use the cascading approach to build rich mental models that reduce endless requests for more charts and filters
- Apply the 'bounded' principle to prevent dashboard proliferation while maintaining necessary detail levels
Tools & Technologies
Business Intelligence platforms Dashboard creation tools Data visualization software
Topics Covered
data-warehousing data-infrastructure data-management
Ready to dive deeper?
Read Full Article on sqlpatterns.com